DRNPG 1503: Information Systems and the Transformation of Global Health Assignment
Assignment Three: Quality Metrics Table
Dr. Kelly Vandenberg
January 26, 2025
How to demonstrate an understanding of nonparametric vs. parametric statistical testing for the DNP project: Oral Health Care in the Underserved Populations
First, one may ask what parametric or nonparametric statistical test is appropriate for measuring oral health care in the underserved population.
Parametric Tests:
- Assumptions: Parametric tests assume that the data follows a specific distribution, typically a standard (bell-shaped curve) distribution (Salkind, 2010).
- Examples: t-tests, ANOVA, and Pearson’s correlation.
- Uses in Cases: when the data is usually distributed and meets other assumptions, such as homogeneity of variances and interval or ratio scale measurement.
- Advantages: Generally, more robust when assumptions are met, providing more precise and reliable results (Laerd Statistics, n.d.).
Nonparametric Tests:
- Assumptions: Nonparametric tests do not require the data to follow a specific distribution. They are often used when the data does not meet the assumptions required for parametric tests.
- Examples: Mann-Whitney U test, Kruskal-Wallis test, and Spearman’s rank correlation.
- Use in Cases: When the data is ordinal, not normally distributed, or when sample sizes are small. Advantages: More flexible and robust in handling various data types and distributions.
The tests explained
Parametric Tests:
- T-test: Use this test to compare the means of two groups (e.g., comparing the average number of dental visits between two different underserved populations). A t-test can compare the average dental visits between two underserved populations (Pagano & Gauvreau, 2018).
- ANOVA (Analysis of Variance): Use this test to compare the means of three or more groups (e.g., comparing the average number of dental visits across multiple underserved populations) (Field, 2018).
- Pearson Correlation: This test measures the strength and direction of the relationship between two continuous variables (e.g., the relationship between oral health knowledge and the number of dental visits) (Cohen et al., 2013).
Nonparametric Tests:
- Mann-Whitney U Test: Use this test to compare the medians of two groups when the data is not normally distributed (e.g., comparing the median number of dental visits between two different underserved populations) (Conover, 1999).
- Wilcoxon Signed-Rank Test: Use this test to compare paired samples (e.g., the number of dental visits before and after an intervention within the same group) (Wilcoxon, 1945).
- Spearman Correlation: Spearman correlation can be used to explore the relationship between oral health knowledge and dental check-up frequency (Spearman, 1904). Parametric tests, which include t-tests and ANOVA, are generally more powerful when the assumptions about the data distribution are met (Laerd Statistics, n.d.). These tests assume that the data follows a normal distribution and that the measurements are on an interval or ratio scale (Salkind, 2010). On the other hand, nonparametric tests do not require the data to follow a specific distribution and are used for ordinal data or when the sample size is small (McCrum-Gardner, 2008).
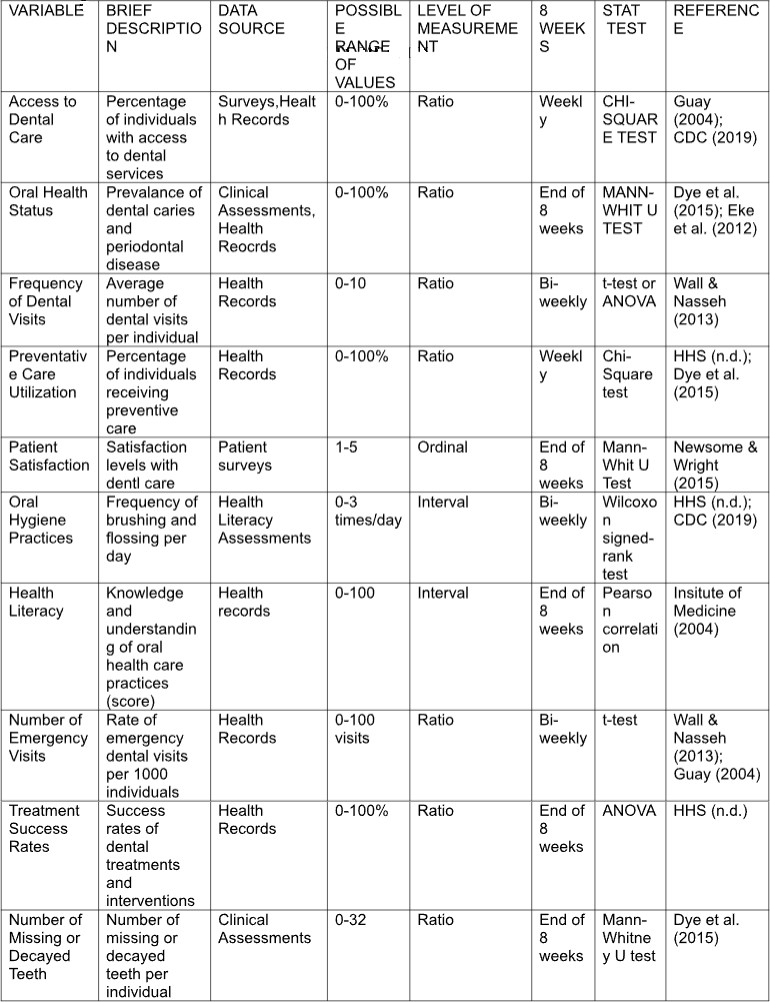
Identify Possible Metrics for the DNP Project: Oral Health Care in Underserved
Populations
Step 1: Identify Key Metrics
Two independent variables for oral health care in underserved populations could be access to dental services and lack of dental insurance. Factors that can affect this variable include the availability of dental clinics, the number of practicing dentists in the area, and the affordability of dental care.
Step 2: Define Variables
The dependent variable would be the oral health outcomes in the underserved population. This can include measures such as:
- Incidence of dental caries (cavities)
- Incidence of periodontal (gum) disease
- Frequency of dental visits
- Oral pain levels
- Number of missing or decayed teeth
- Overall oral health status
These outcomes depend on the independent variable, access to dental care services.
Step 3: Determine Variable Types
Classify the variables into different types:
- Quantitative Variables are measurable and expressed numerically (e.g., the number of dental visits and the prevalence of dental caries).
- Qualitative Variables are descriptive and expressed in categories (e.g., patient satisfaction levels and oral hygiene practices).
Step 4: Choose Measurement Methods
Select appropriate methods to measure each variable:
- Surveys and Questionnaires: Collect data on patient satisfaction, oral hygiene practices, and health literacy.
- Clinical Assessments: Dental examinations are conducted to measure oral health status, the prevalence of dental caries, and periodontal disease.
- Oral Health Care Kit: On Day 1, provide tools such as a toothbrush, toothpaste, dental floss, fluoride, Scope oral rinse, a mirror, and Chapstick with instructions.
- Health Records: Dental records track the frequency of dental visits and preventive care utilization.
Step 5: Set Measurement Frequency
Determine how often each variable will be measured:
- Annually: For metrics like access to dental care and oral health status.
- Biannually: For patient satisfaction and preventive care utilization.
- Weekly, Monthly, or Quarterly: For variables that require more frequent monitoring, such as emergency dental visits.
Step 6: Establish Goals and Benchmarks
Set goals and benchmarks for each metric to evaluate progress and success:
- Access to Dental Care: Aim for ≥ 75% of the population to have dental services.
- Oral Health Status: Target a prevalence of dental caries and gum disease below 25%.
- Frequency of Dental Visits: The goal is to have≥ two dental visits per year per individual.
- Preventive Care Utilization: Aim for ≥ 60% of individuals receiving preventive services.
- Patient Satisfaction: Target an average score of ≥ 4.0 on a scale of 1-5.
Step 7: Analyze and Report Data
Analyze the collected data regularly and report findings to stakeholders. Use the data to identify areas for improvement and develop targeted interventions.
Step 8: Continuous Improvement
The metrics and measurement methods should be continuously monitored and adjusted based on feedback and outcomes to ensure ongoing improvement in oral health care for underserved populations. This systematic approach will help gather meaningful data and make informed decisions about improving oral health outcomes.
Power analysis is crucial in experimental design to ensure that your study has enough participants to detect a meaningful effect. Here is how you can apply power analysis to determine an appropriate sample size:
Steps to Conduct a Power Analysis:
- Define Your Hypotheses:
- Null Hypothesis (H0): There is no effect or difference.
- Alternative Hypothesis (H1): There is an effect or difference.
- Choose the Statistical Test:
- Determine which statistical test you will use (e.g., t-test, ANOVA, chi-square test).
- Determine the Effect Size:
- Effect size is the magnitude of the difference or relationship you expect to find. Standard measures include Cohen’s d for differences between means or odds ratios for binary outcomes.
- Set the Significance Level (α):
- The probability of making a Type I error (rejecting a true null hypothesis) is commonly set at 0.05.
- Set the Power Level (1−β):
- Typically set at 0.80 or 0.90, this is the probability of correctly rejecting a false null hypothesis (1 minus the probability of a Type II error).
- Estimate Variability:
- Use data from previous studies, pilot studies, or literature to estimate the variability in your data.
- Conduct the Power Analysis:
- Use statistical software (e.g., Intellectus) to input the above parameters and calculate the required sample size.
To compare the average number of dental visits between two groups: individuals with and without dental insurance.
- Hypotheses:
- H0: There is no difference in the average number of dental visits.
- H1: There is a difference in the average number of dental visits.
- Effect Size: Based on previous studies, you estimate a medium effect size (Cohen’s d =0.5).
- Significance Level: α=0.05
- Power Level: 1−β=0.80
- Variability: Estimated from previous studies or pilot data.
You can input these parameters into a power analysis tool to determine the required sample size (Frost, 2024).
References
Centers for Disease Control and Prevention (CDC). (2019). Oral Health Surveillance Report, 2019 - Trends in dental caries and sealants, tooth retention, edentulism, and dental visits among children and adults—United States, 1999-2004 to 2013-2016.
Cohen, J., Cohen, P., West, S. G., & Aiken, L. S. (2013). Applied Multiple Regression/Correlation Analysis for the Behavioral Sciences (3rd ed.). Routledge.
Conover, W. J. (1999). Practical Nonparametric Statistics (3rd ed.). John Wiley & Sons.
Dye, B. A., Thornton-Evans, G., Li, X., & Iafolla, T. J. (2015). Dental caries and tooth loss in adults in the United States, 2011-2012. NCHS Data Brief, (197), 1-8.
Eke, P. I., Dye, B. A., Wei, L., Thornton-Evans, G. O., & Genco, R. J. (2012). Prevalence of periodontitis in adults in the United States: 2009 and 2010. Journal of Dental Research, 91(10), 914–920.
Field, A. (2018). Discovering Statistics Using IBM SPSS Statistics (5th ed.). Sage Publications.
Frost, J. (2024). "How to Calculate Sample Size Needed for Power." Statistics by Jim. Retrieved from Statistics by Jim
Guay, A. H. (2004). Access to dental care: Solving the problem for underserved populations. Journal of the American Dental Association, 135(11), 1599–1605.
Institute of Medicine (US) Committee on Health Literacy. (2004). Health Literacy: A Prescription To End Confusion. National Academies Press.
Laird Statistics: "Parametric and Non-Parametric Tests for Comparing Two or More Groups." Retrieved from Laerd Statistics
McCrum-Gardner, E. (2008). "Which is the correct statistical test?" British Journal of Oral and Maxillofacial Surgery, 46(1), 38–41. doi:10.1016/j.bjoms.2007.09.002
Newsome, P. R. H., & Wright, G. H. (1999). A review of patient satisfaction: 2. Dental patient Satisfaction: an appraisal of recent literature. British Dental Journal, 186, 166–170.
Pagano, M., & Gauvreau, K. (2018). Principles of Biostatistics (2nd ed.). CRC Press.
Salkind, N. J. (2010). Encyclopedia of Research Design. Thousand Oaks, CA: Sage Publications, Inc.
U.S. Department of Health and Human Services (HHS). (n.d.). Healthy People 2030 Oral Health Objectives. Retrieved from Healthy People 2030
Wilcoxon, F. (1945). Individual comparisons by ranking methods. Biometrics Bulletin, 1(6), 80–83.